Cashflow Analysis
View account balance trends and income/expense patterns over time with DocuClipper's Cashflow Analysis charts, filter by date range, account, and export to CSV.
Last updated
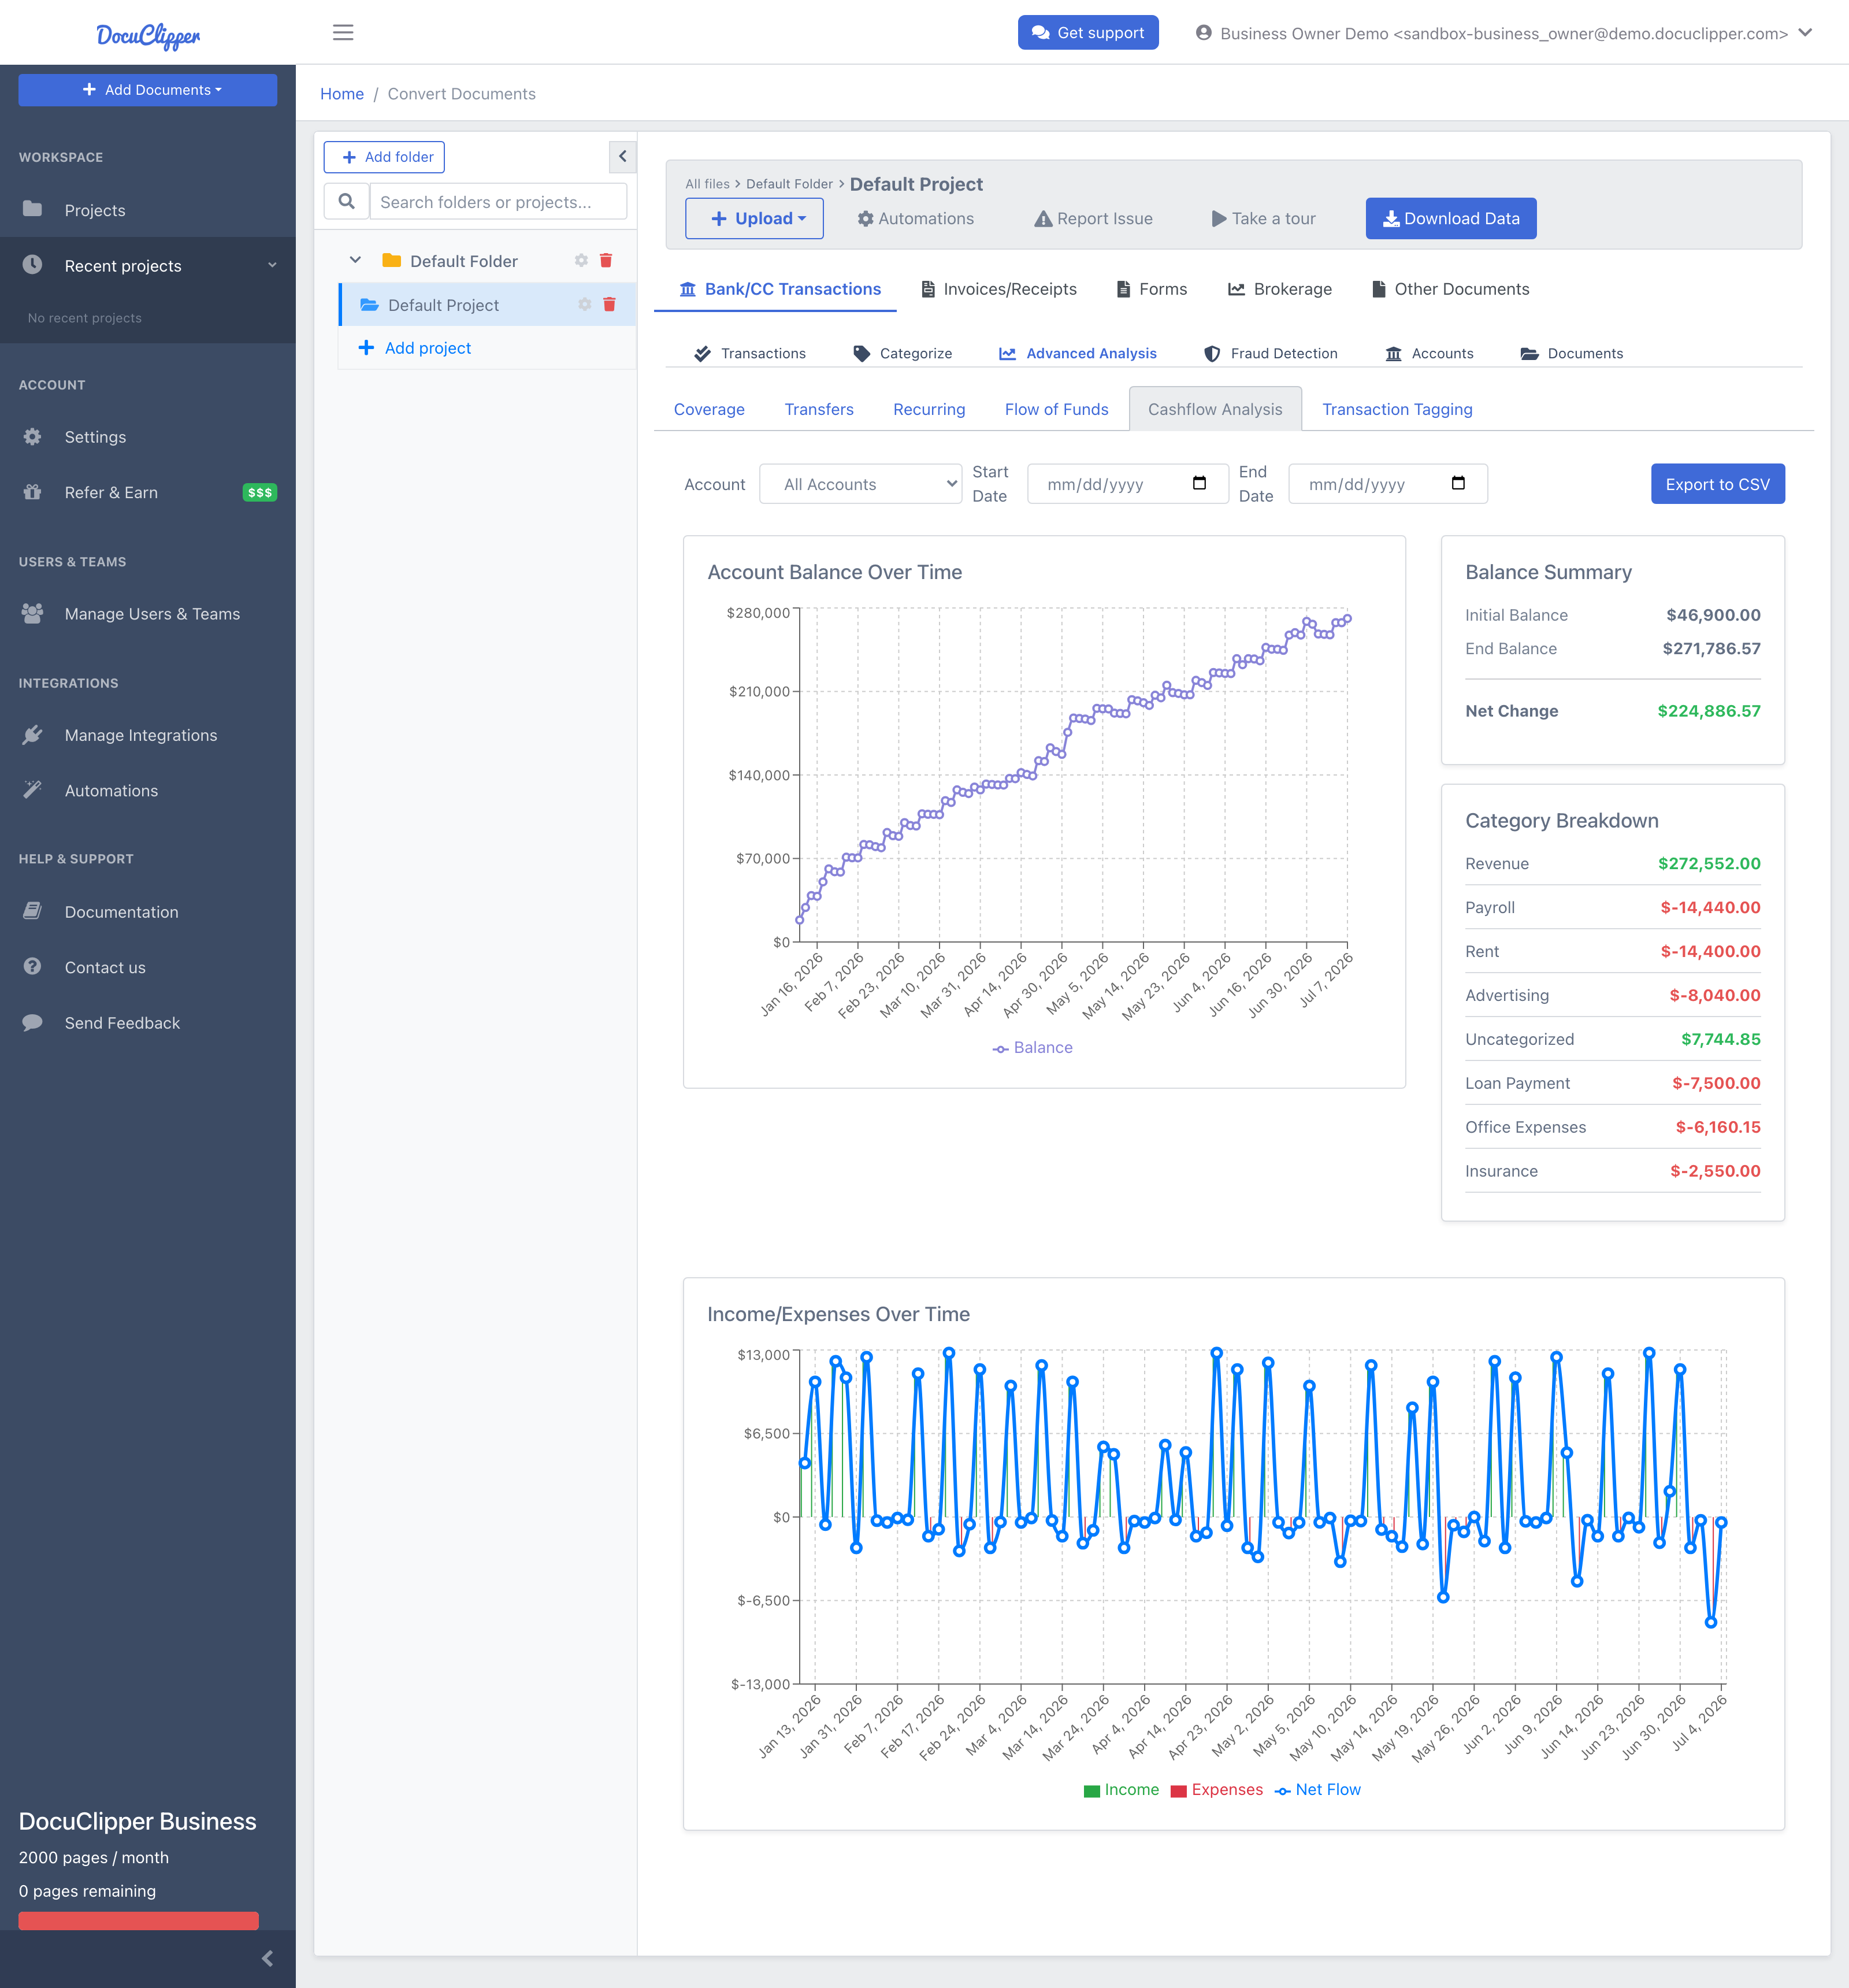
Cashflow Analysis provides two charts: account balance over time and income/expenses over time. The dual-chart view helps you see both account performance and cash-flow dynamics for a single account or across every account at once.
Overview
What it does:
- Balance Tracking: shows how account balances change over time
- Income/Expense Visualization: displays daily income and expenses with net flow
- Date Range Filtering: analyze specific time periods
- Account Selection: focus on one account or aggregate all accounts
- Summary Statistics: key metrics and category breakdowns
- Export Capabilities: download analysis results
Chart Types
Account Balance Over Time
A line chart showing daily balance progression. Helps identify trends, peaks, and valleys, useful for understanding overall account performance.
Income/Expenses Over Time
A bar chart with income (green bars above the axis) and expenses (red bars below the axis), plus a blue line showing net cash flow. Makes it easy to compare income vs. expenses at any point in time.
How to Use
- Open a converted bank or credit-card project and open the Advanced Analysis section, then the Cashflow Analysis tab.
- Pick an account from the selector, or leave it on All Accounts to see every account aggregated.
- Set a date range (optional; leave blank to analyze the full available period).
- Review the charts:
- Top chart shows balance progression.
- Bottom chart shows income/expenses with net flow.
- Check the summary panel on the right for the balance summary and category breakdown.
- Click Export to CSV to download the balance summary and category totals.
Understanding the Charts
Balance Chart
| Element | Description |
|---|---|
| X-axis | Timeline (dates) |
| Y-axis | Account balance amounts |
| Line | Daily balance progression |
| Upward trend | Growing balance |
| Downward trend | Declining balance |
Income/Expenses Chart
| Element | Description |
|---|---|
| Green bars | Daily income (above x-axis) |
| Red bars | Daily expenses (below x-axis) |
| Blue line | Net cash flow (income minus expenses) |
| Hover | Exact amounts and dates |
Summary Panel
- Initial Balance: starting balance for the period
- End Balance: ending balance for the period
- Net Change: total change during the period
- Category Breakdown: income and expense totals by category
Common Use Cases
- Performance Tracking: monitor account growth or decline over time
- Cash Flow Planning: understand income and expense patterns
- Seasonal Analysis: identify cyclical patterns in cash flow
- Budget Analysis: compare actual vs. expected cash flows
- Client Reporting: visual representation of financial performance
- Investigation: identify unusual balance changes or cash flow patterns
Tips
- Use shorter date ranges for more detailed analysis.
- Look for correlations between balance changes and cash flow patterns.
- Pay attention to the net flow line for overall financial health.
- Analyze each significant account separately to get the full picture.