
Flow of Funds Analysis
Trace how money moved across accounts, identify transfers, and follow funds with a filterable Sankey diagram and transaction table.
Flow of Funds answers "where did this money come from, and where did it go?" across one or many accounts. It's useful for forensic accounting, fraud investigations, and cross-account reconciliation. Flow of Funds is available on the Business and Enterprise plans.
Opening the analysis
- Open the bank or credit-card project that contains the converted statements you want to analyze.
- Open the Advanced Analysis section.
- Select the Flow of Funds tab.
The analysis uses the transactions from every statement in the project. Flow of Funds is built from categorized transactions - if you see "No categorized transactions found," open the Categorize tab first, assign categories, then return. To narrow the view, use the filter bar at the top of the chart (see below).
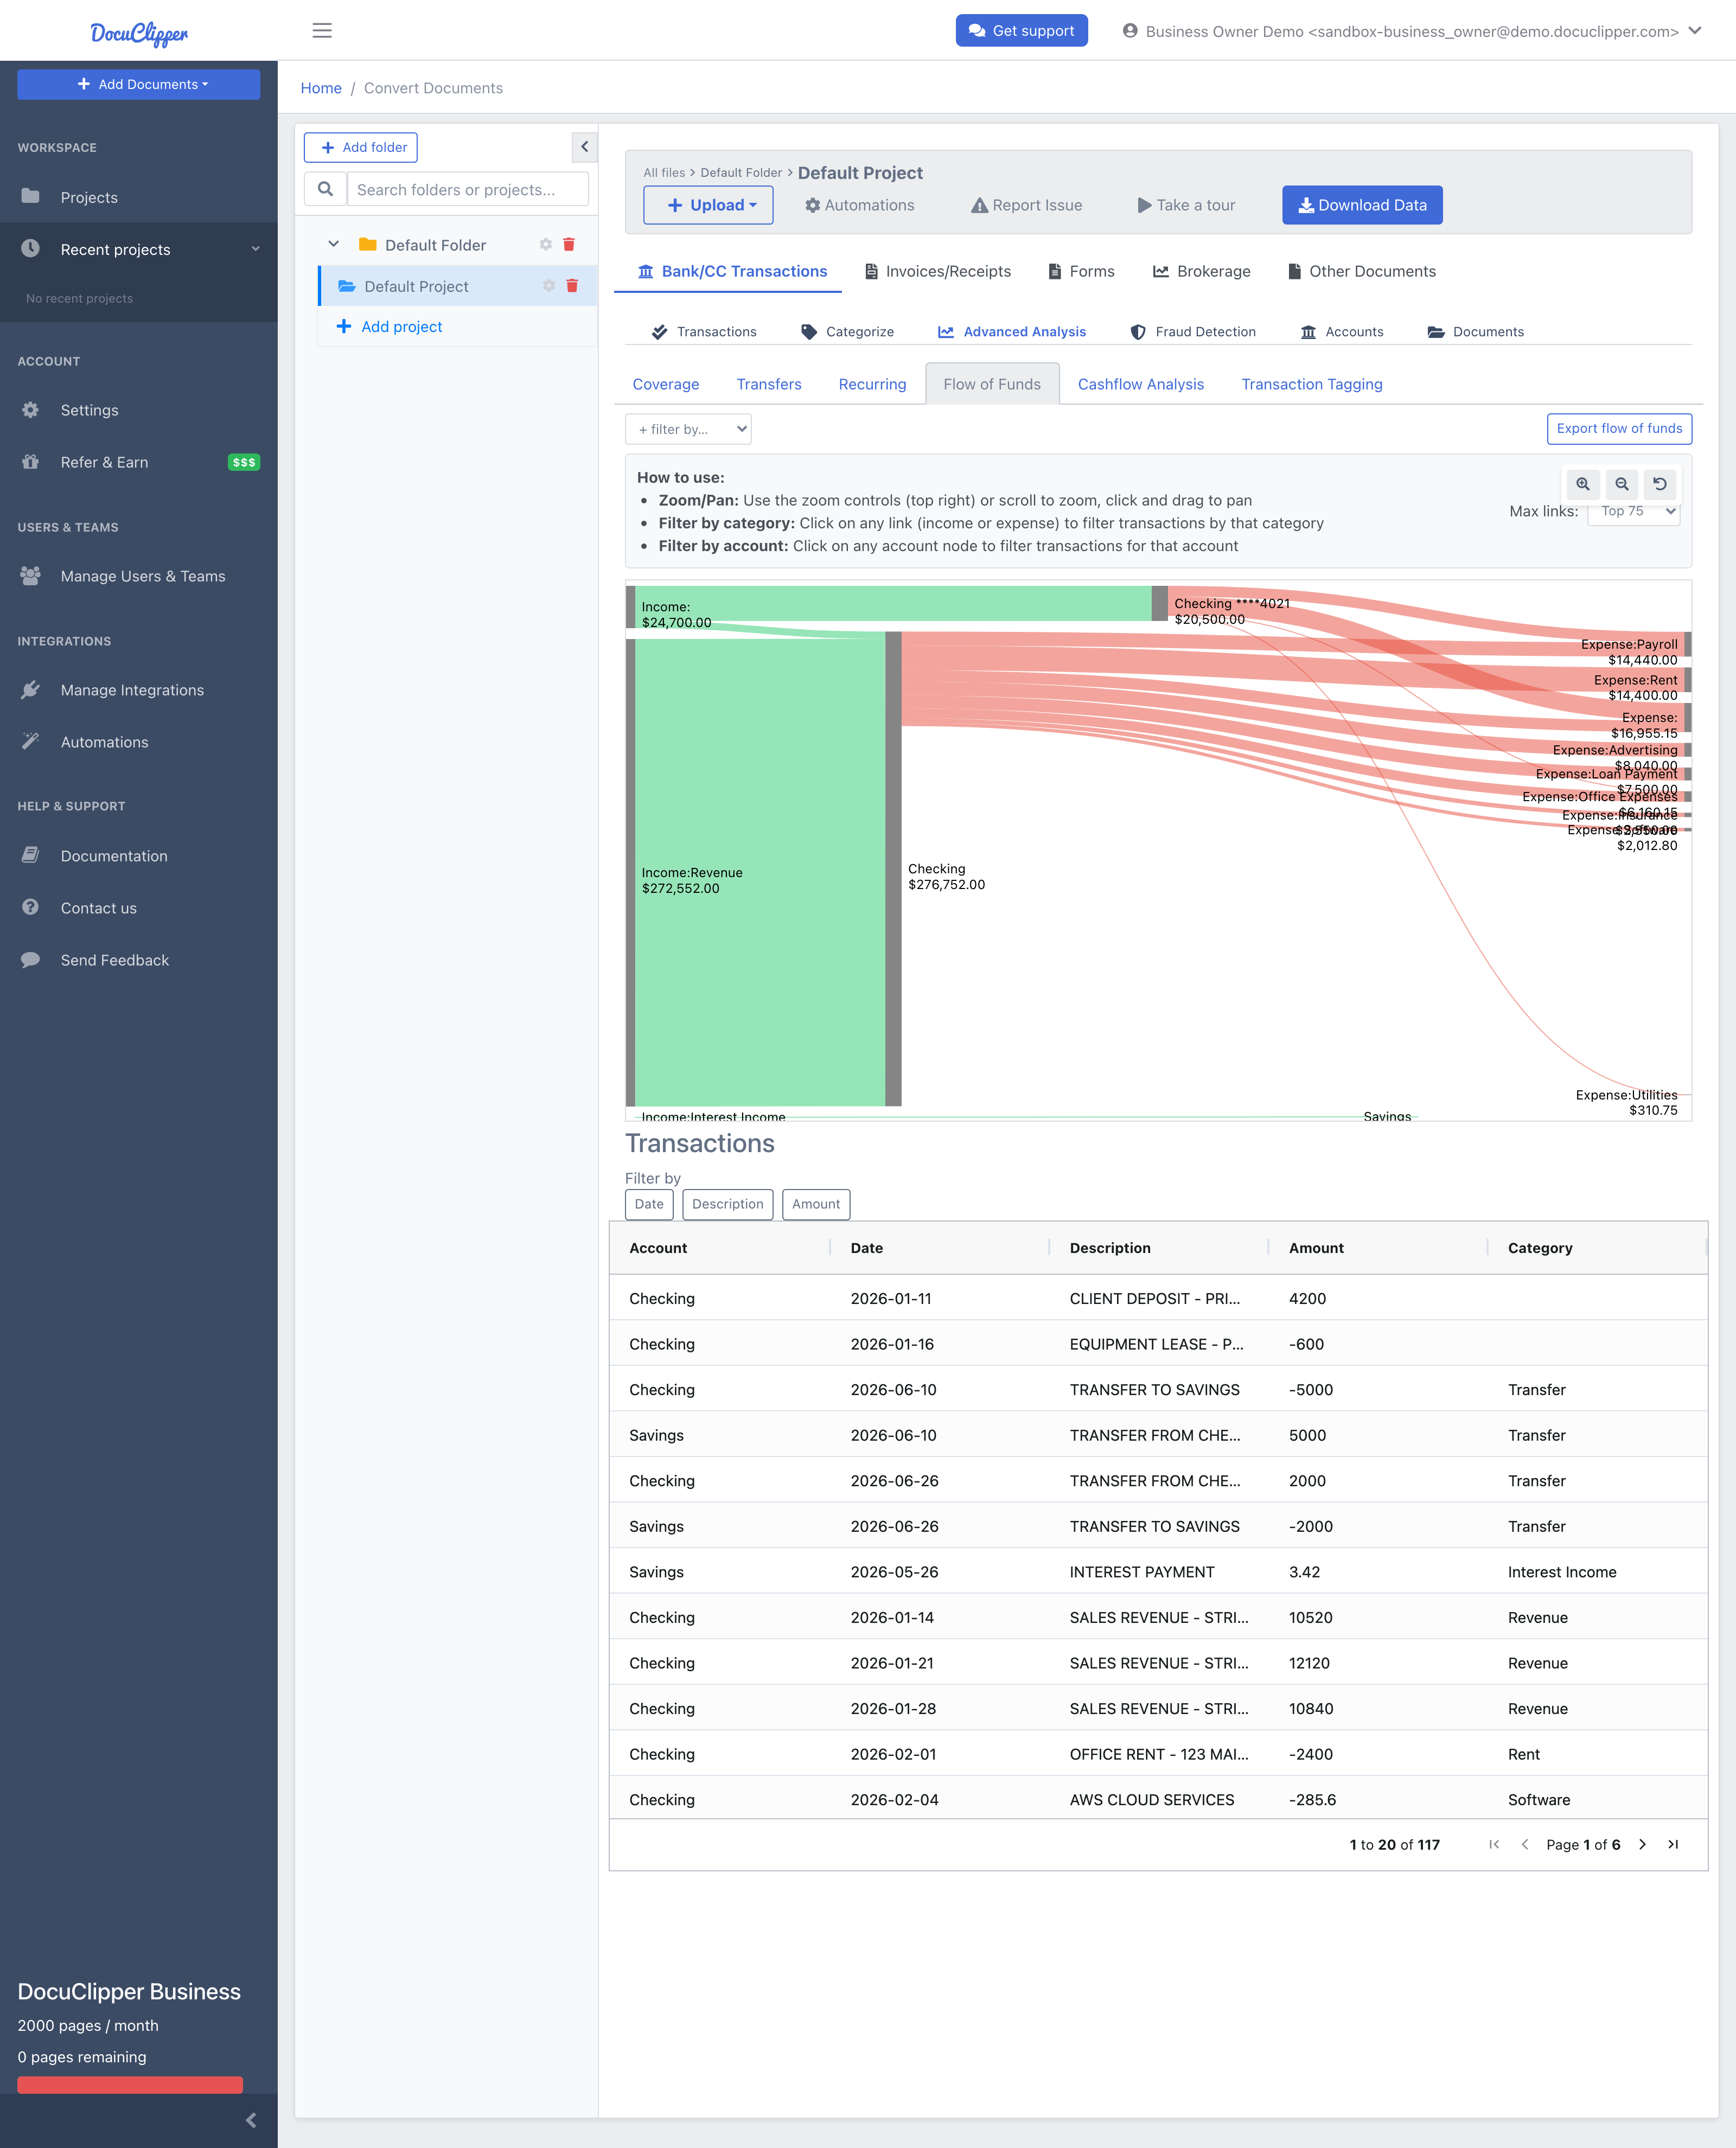
Filtering by account holder or role
The filter bar at the top of the chart has two dropdowns: + filter by… scopes by any attribute you've tagged on an account (holder, subject_role, account_type, custodian, currency, or any free-form key), and + add account… scopes to specific accounts. Each choice becomes a removable chip, and chips combine - applying holder=Subject A and subject_role=counterparty narrows the view to flows involving Subject A and any account you've tagged as a counterparty.
Clicking on the Sankey also adds a chip instead of navigating away: clicking an account node pins that account, and clicking a link pins that source→destination flow. The chart, the transaction table below it, and the URL all stay in sync, so the URL is a shareable snapshot of the exact view.
To tag accounts in the first place, open the Accounts tab on the project. See Multi-Account Forensic Tracing for the full holder/role workflow.
Exporting the analysis
Click Export flow of funds to download a multi-sheet XLSX of the current filtered view. The download is XLSX even though the route URL retains /csv for backward compatibility - any older mention of "CSV export" in this docs site refers to the same button.
The workbook has three sheets:
- Transactions - every filtered transaction with account holder, institution, and transfer-match columns so each row is self-contained.
- Between accounts - aggregated source/destination pairs (the data behind the Sankey) with an
edge_typeoftransfer,inflow, oroutflow. - Account totals - one row per account with period, total inflows, total outflows, net, and transaction count.
See Multi-Account Forensic Tracing for how to use each sheet in a forensic deliverable.
On the free trial, the workbook is a sample: the Transactions sheet carries the transactions your trial export allowance covers, the other two sheets are computed from those same transactions, and each sheet starts with a note stating the trial limit. Downloading it again gives you the same sample. See DocuClipper free trial.
What you get
The view has two parts that stay in sync with your filters:
- Sankey diagram - income sources on the left, your accounts in the middle, and expense destinations on the right. The width of each link is proportional to the dollars that moved along it, so the largest flows stand out at a glance.
- Transaction table - every underlying transaction (account, date, description, amount, category) below the chart. It narrows to whatever chip you have applied, so clicking a link on the Sankey and then reading the table shows exactly the transactions behind that flow.
Self-transfers
Transfers between accounts you own (e.g. checking → savings) are detected automatically when the matching debit and credit appear on different statements in the same project within a few days and with matching amounts. They're surfaced separately so they don't inflate income or expense totals. See Transfers Analysis.
A typical investigation
- Upload all relevant bank statements for the period under review, then categorize the transactions.
- Open Flow of Funds to see the full Sankey diagram.
- Filter by account or by a tagged attribute (holder, counterparty, and so on), or click a link on the chart to isolate one flow.
- Read the transaction table below the chart to see the underlying transactions for the current view.
- Export the workbook to share the analysis with your team or client.